Website analytics that tell you who visited, whether they got in touch, and what to fix
Open the Digital Hub and the first thing you see is who visited your website today: where they came from, including ChatGPT, Copilot and Perplexity, which pages they read, and whether they called or filled in a form. Underneath that, Clearview works out what to fix to win more enquiries. And when it finds a broken page or a script error, it opens a ticket and we fix it.
Everything your business runs online, watched from one place.
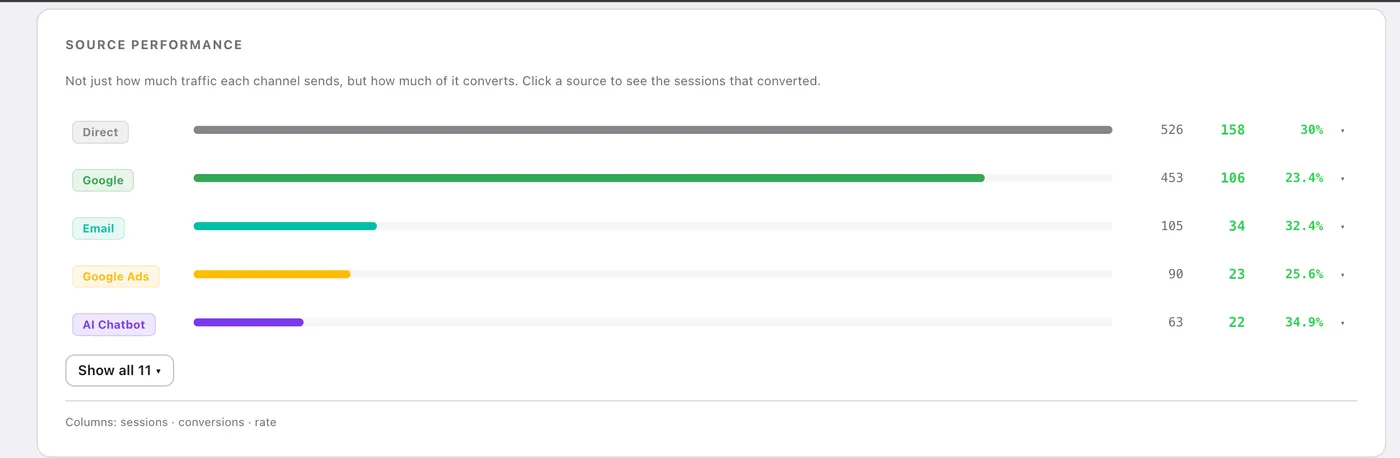
Where visitors come from
Search, social, referrals, ad campaigns and AI assistants, with the pages they landed on and how far they read. Each source shows not just how much traffic it sends but how much of it converts, so you can see that an AI chatbot referral is worth more than a directory listing. Returning visitors are counted separately, because people who come back are the quietest sign that your site and marketing are landing.
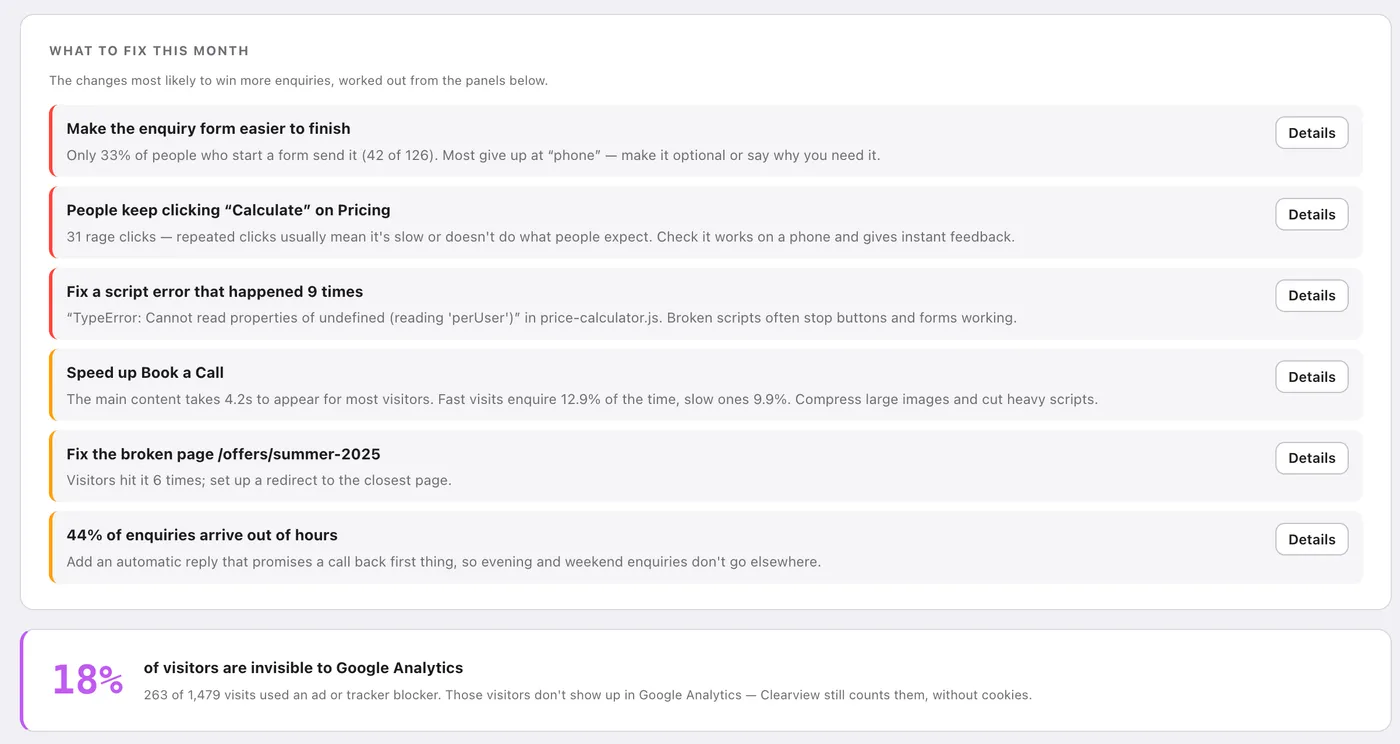
What to fix this month
Every month, the Digital Hub works out the handful of changes most likely to win more enquiries, in plain English, from the data underneath: a form that loses two thirds of the people who start it, a button people keep clicking because it does nothing, a page that takes four seconds to appear, a broken link from a directory. Each one has the evidence behind it. You do not have to read the charts to know what to do next. It also tells you how many of your visitors are invisible to Google Analytics because they run a tracker blocker. Clearview still counts them, without cookies.
Whether they got in touch
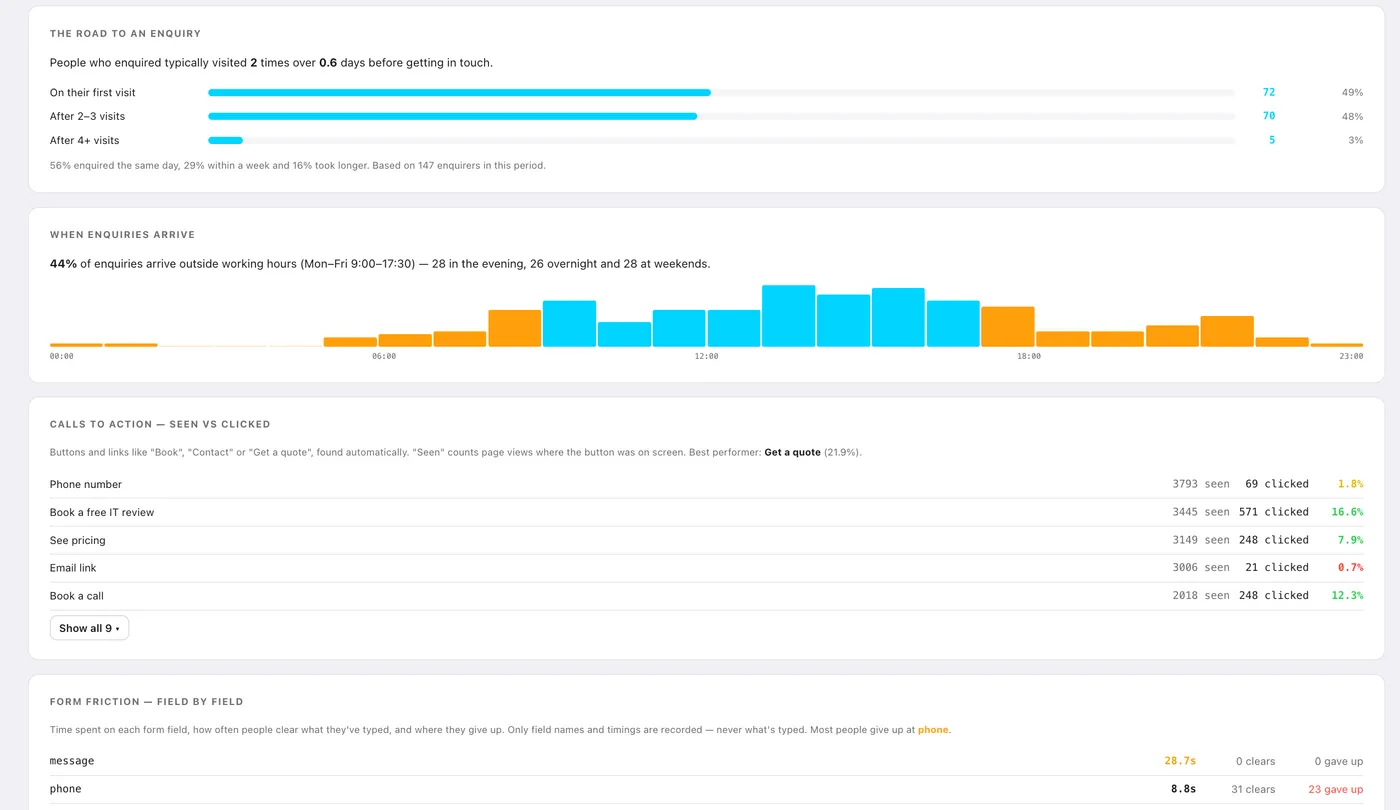
Form submissions, phone taps, email clicks, downloads and video plays are counted automatically, with nothing to set up. Clearview then shows you the road to an enquiry: how many visits people make before they get in touch, what time of day enquiries arrive, and which buttons get seen but never clicked. Form friction is measured field by field, so you can see that most people give up at "phone" and make it optional. Only field names and timings are recorded, never what anyone types.
Companies that visited
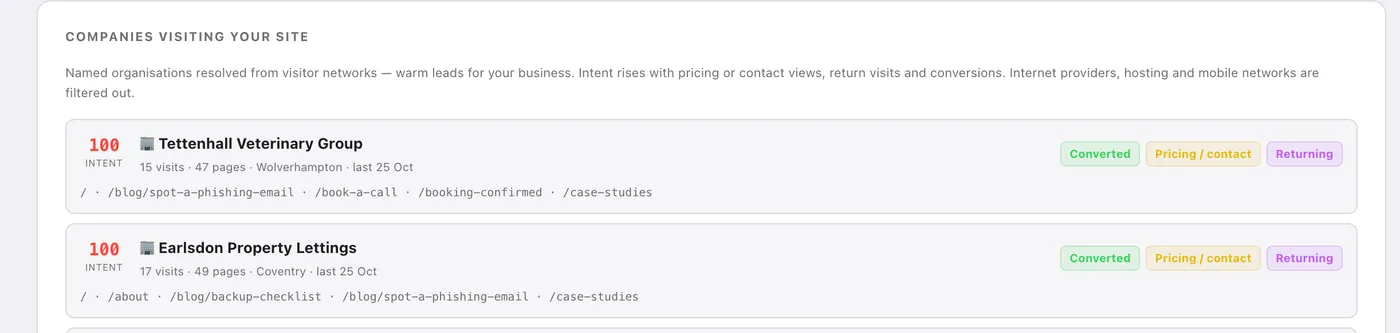
Named businesses that visited your site, resolved from their network, with an intent score that rises when they look at pricing or contact pages, come back, or convert. Internet providers, hosting and mobile networks are filtered out, so you are never told that BT visited your website.
Where people click, and where they get stuck
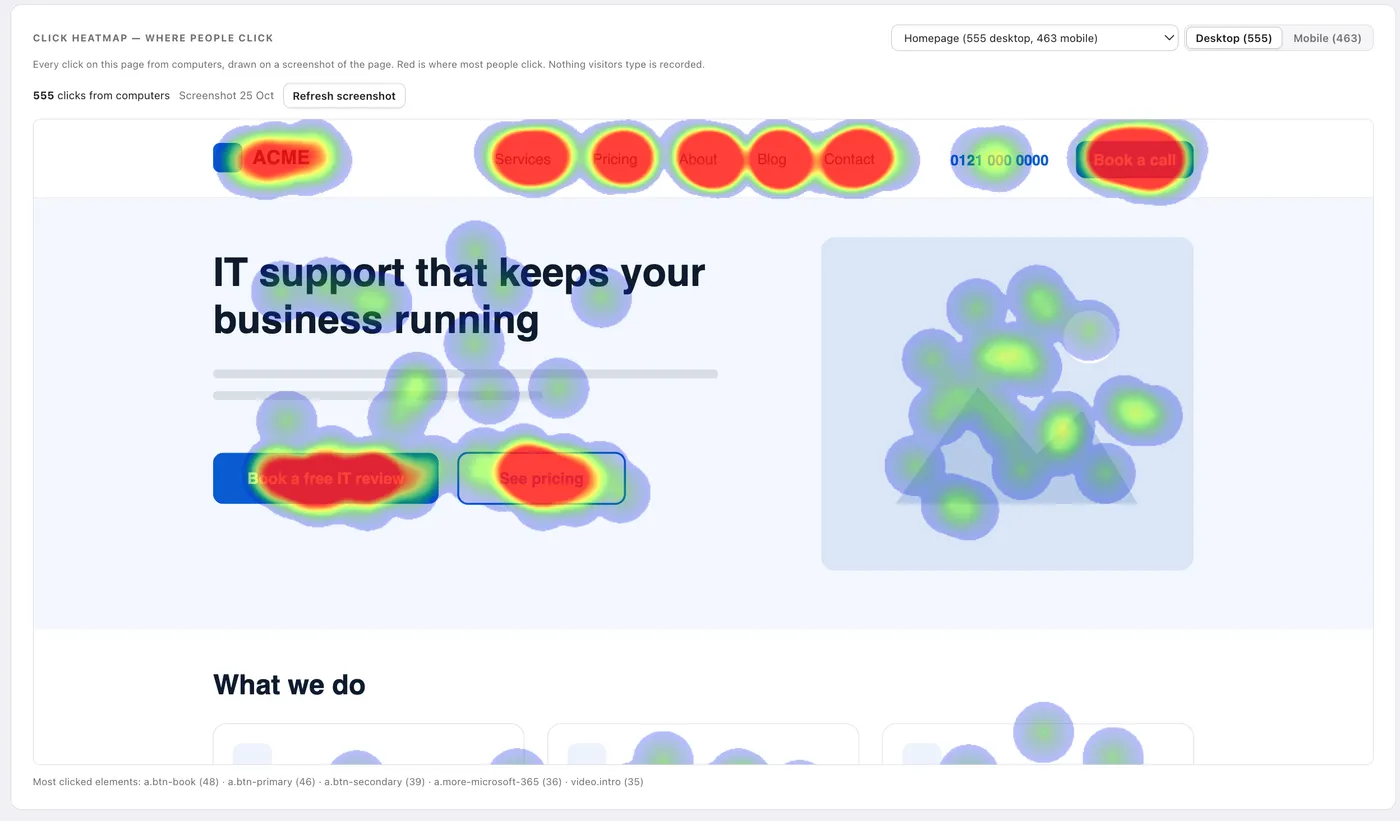
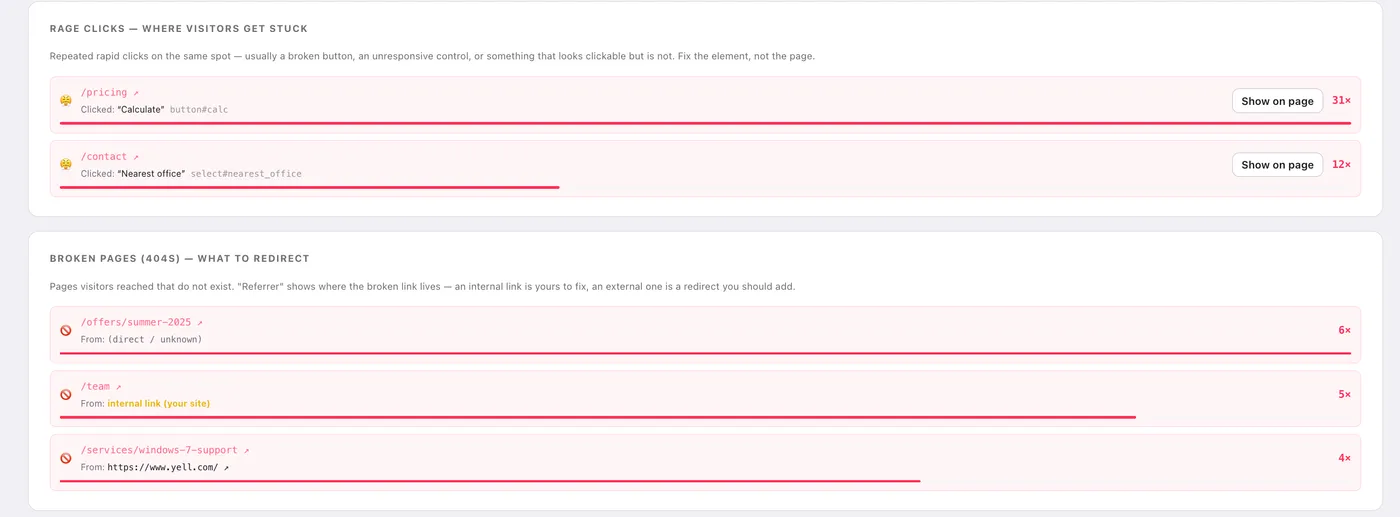
A click heatmap drawn on a screenshot of your own page, for computers and phones separately, shows where people actually click. Rage clicks, which are repeated rapid clicks on the same spot, are described in plain words, such as "Calculate on Pricing, 31 times", and a Show on page button marks the exact spot. Broken pages show where the dead link lives, so you know whether it is yours to fix or a redirect to add.
Website problems become tickets
Script errors and broken pages used to be a line in a report telling you to contact your web developer. We are your web developer. Now, when the Digital Hub sends your analytics report, each problem it found opens a support ticket with the reference in the report, and we deal with it. One ticket per problem until it is fixed, and you can watch it in the Tickets tab alongside everything else.
Ask about your website
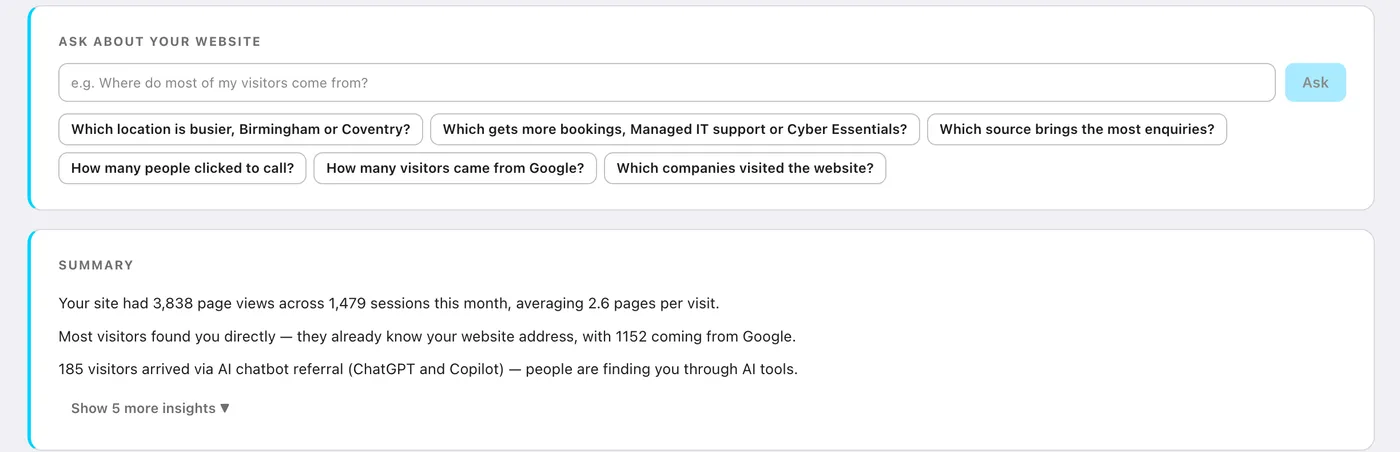
Type a question. "Which source brings the most enquiries?" "How many people clicked to call?" "Which companies visited the website?" The Digital Hub answers from your own data, and the monthly summary underneath is written the same way: "185 visitors arrived via AI chatbot referral. People are finding you through AI tools."
Every visit, replayed
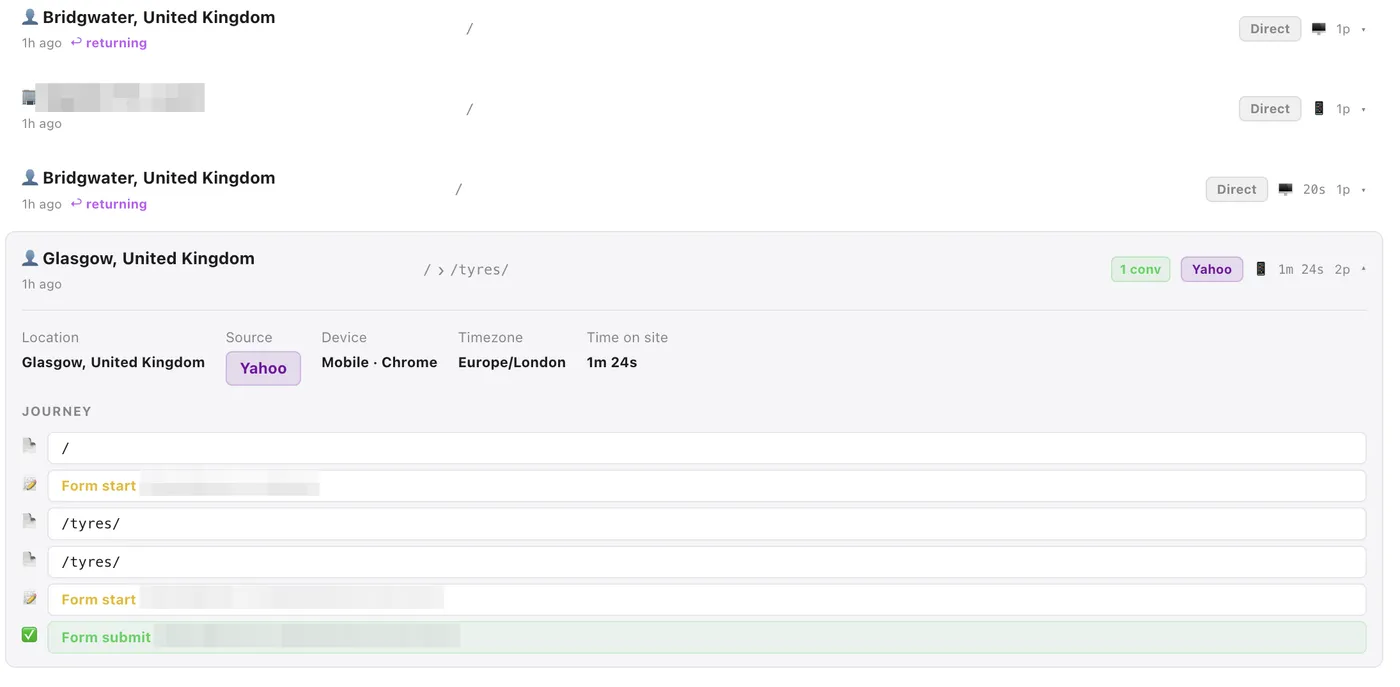
Pick a visit and see it in order: each page, each click, the form they started and whether they finished it. It is the difference between knowing you had 64 sessions and knowing what one of them actually did.
Search, AI search and speed
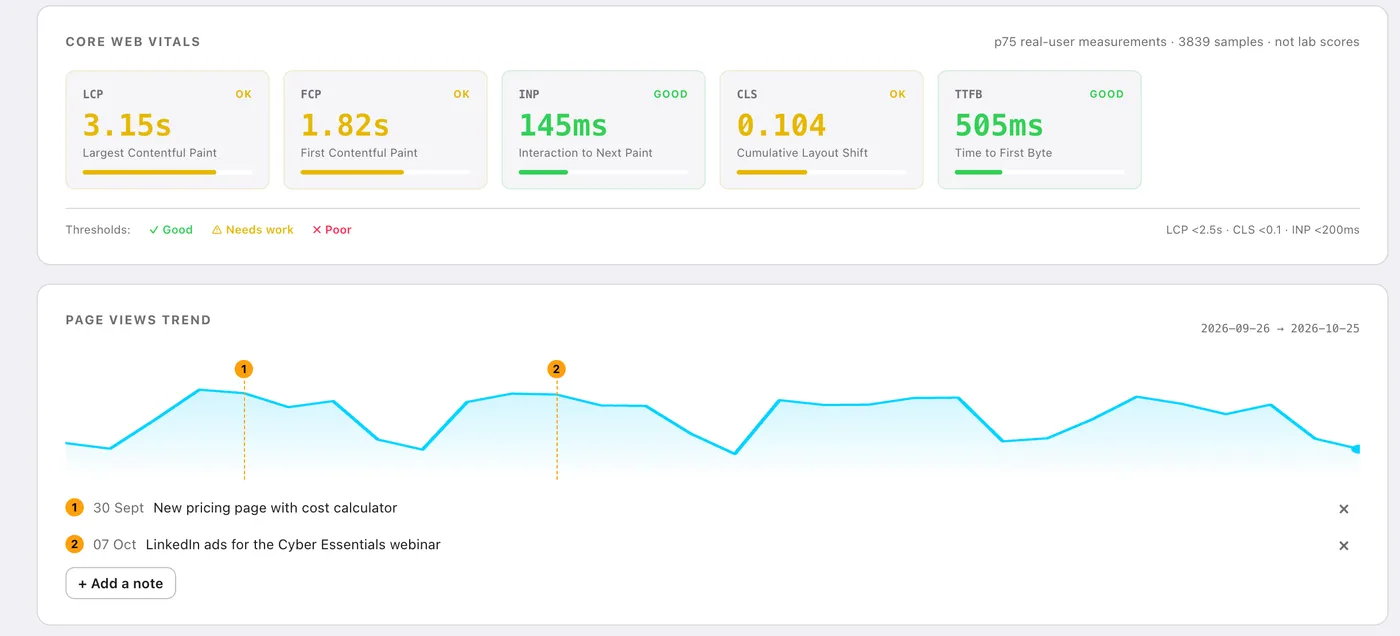
A technical SEO score tracked over time, GEO showing how visible you are when someone asks an AI assistant, and Core Web Vitals measured from real visitors rather than a lab test, so the number is the one Google sees. Add a note to the trend chart when you change something and see what it did. Domain registrations, certificates and cookie compliance are watched alongside, so a lapsed renewal never takes the site down.
Ten live websites, watched from here
Every site below is live today. Each one is hosted, secured and measured through the Digital Hub: the owner can see who visited, where they came from and whether they got in touch, and we can see the site is up, fast, certificated and not on anybody’s blacklist. Click through and judge for yourself.

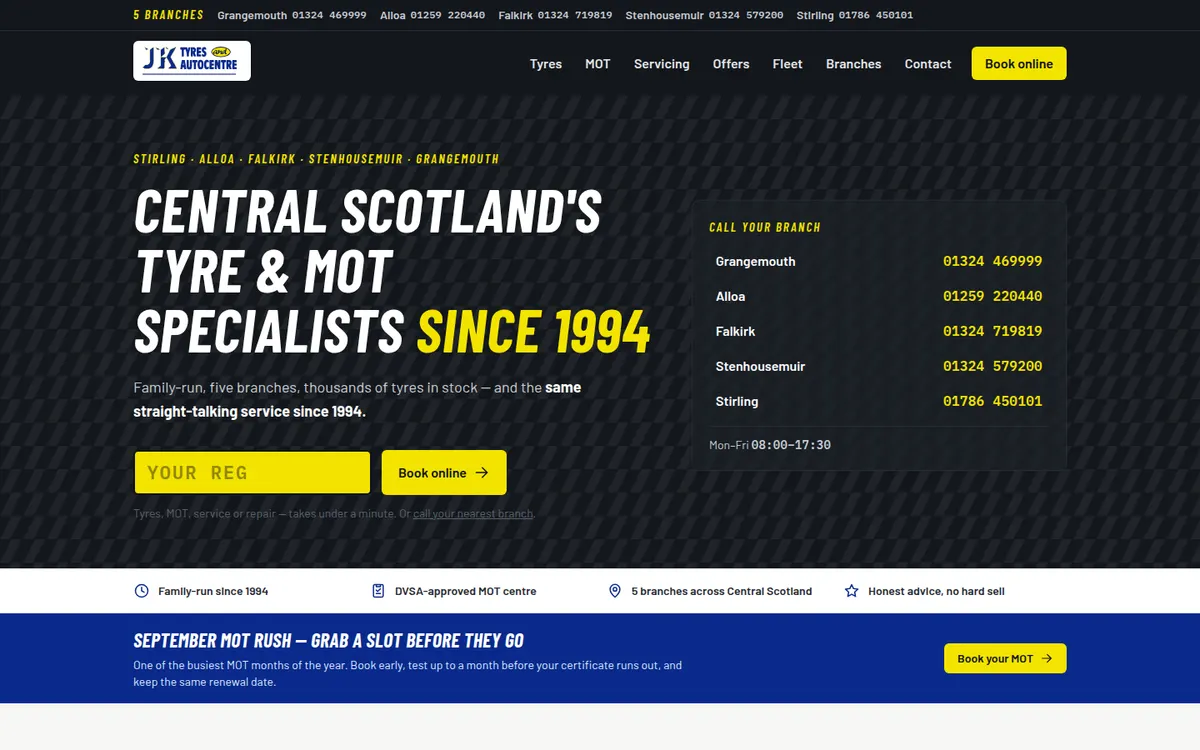





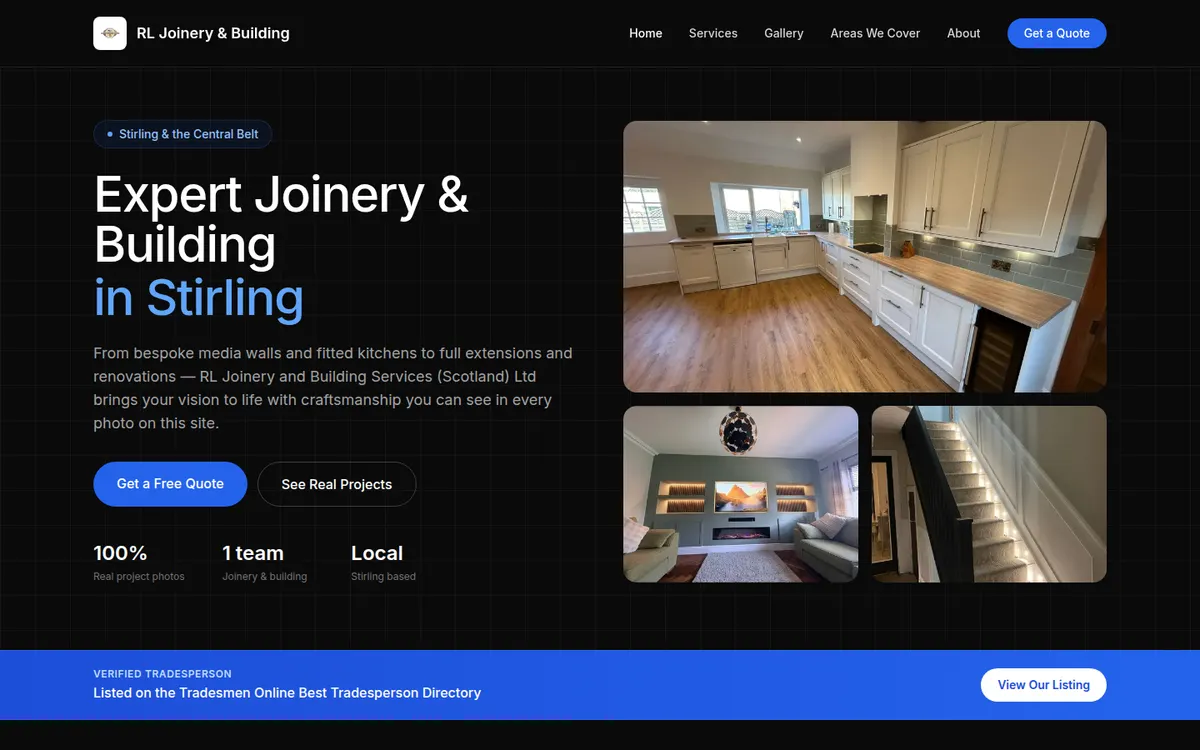


Designed and built by Swanswater. Hosted, secured and measured through Clearview by STG.
What the Digital Hub covers
- Website analytics: visitors, sources, top pages, conversions
- Source performance: which channels convert, not just which send traffic
- Companies that visited, with ISPs filtered out
- What to fix this month: plain-English recommendations with the evidence
- Every visit replayed step by step
- Click heatmaps, rage clicks and form friction, shown on your own pages
- Script errors and broken pages raised as tickets, fixed by us
- First-touch and last-touch attribution
- Technical SEO score and GEO: how visible you are in AI search
- Performance and Core Web Vitals from real visitors
- Domain registrations, certificates and cookie compliance
All of it is first-party measurement: no third-party cookies, no advertising trackers, and your visitor data is held in the UK and never shared or sold.
Coming next
Backlinks (every site that links to yours) and domain ranking, then Google Search Console and Google Ads brought into the same view with recommendations.
The other hubs
See it on your own business
A demonstration takes half an hour and uses your domain, so the first score you see is yours. Existing clients can log in straight away.